2025 Landscape Overview
Digital Agency Industry Report
Digital agencies are able to generate an above-average level of net income, they have few, if any, barriers to entry, and the market as a whole is growing at a rapid pace. This makes digital agencies an attractive industry for many participants.

Executive Summary
A Maturing Market
The digital agency industry in 2025 is a crowded, maturing sector where macro forces play as much of a role as strategic or operational excellence in determining the winners and losers.
Agencies that adapt their offerings, sharpen their positioning, and build repeatable revenue engines are pulling ahead, while those standing still fall behind.
The overwhelming majority of agencies now identify as specialists (84%), signaling that broad-based generalist positioning is no longer viable. Even among the specialists, those that fail to articulate how their specialization delivers superior value will struggle to maintain pricing power or customer loyalty.
The firms growing fastest are those that make strategic shifts. Agencies that expanded services grew 9.7% in 2024, and those that repositioned their offerings grew 8%. In contrast, agencies that made no changes grew just 1.1%.
Services like mobile app development, UX/UI, and even standard web design are declining, while newer or resurgent categories like AI integration, SEO, and content marketing are on the rise. Agencies that haven’t realigned their services risk commoditization.
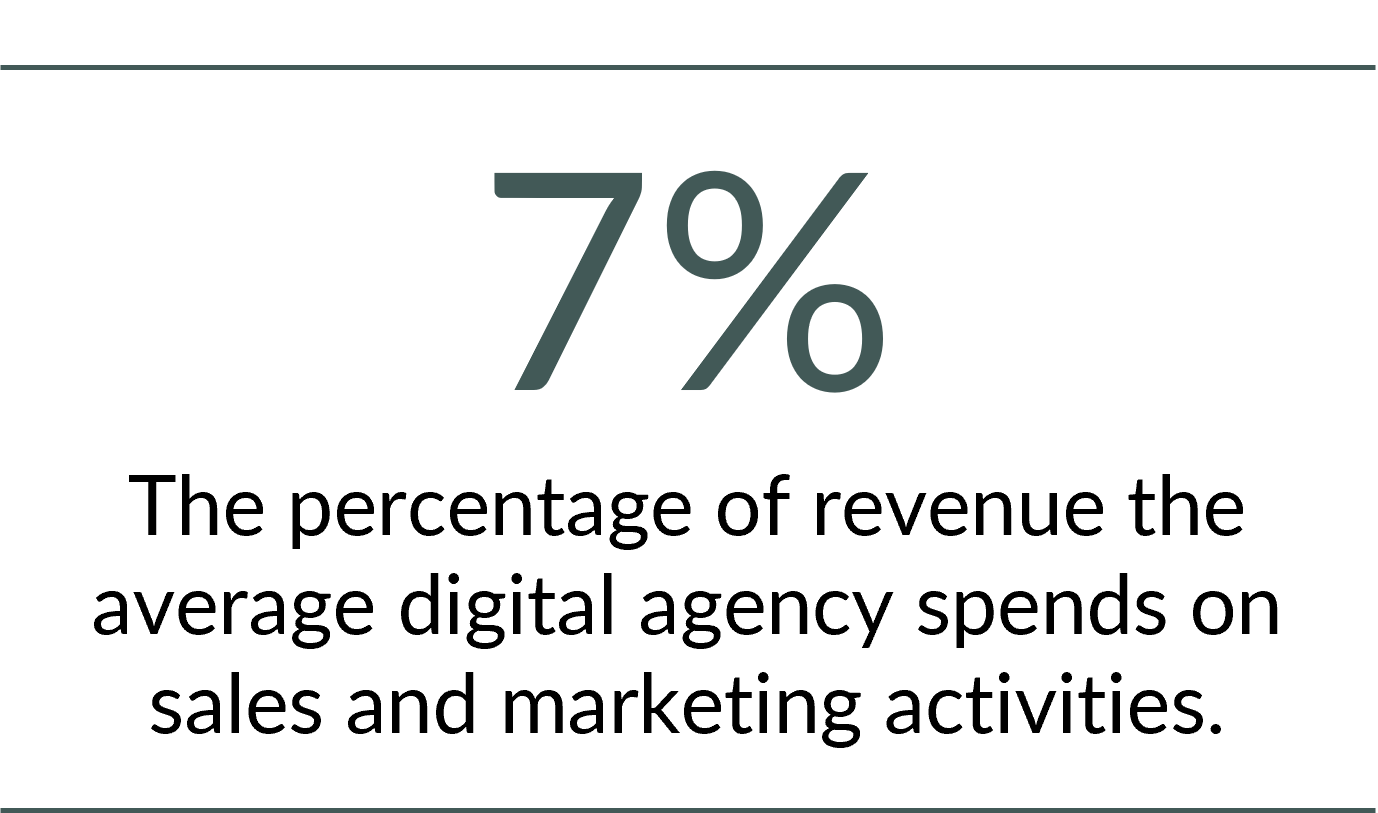
Most agencies still depend on referrals, which are high-trust but low-control. The average firm spends just 7% of revenue on marketing and sales. Passive referrals aren’t a growth strategy. Agencies seeking sustained growth must build structured go-to-market systems that attract, qualify, and convert demand, especially as competition intensifies and differentiation blurs.
Growth now depends less on being capable and more on being valuably different. Agencies that clarify their positioning, adjust their offerings in response to structural market shifts, and invest in scalable growth engines will outperform. Those that continue to conflate execution with strategy will be stuck fighting over shrinking margins and increasingly undifferentiated work.
What’s missing from your revgen strategy?
Remove growth blockers, gain real revgen traction, and grow more reliably.
We’ve helped hundreds of agencies over the years, and our research has covered thousands more.
We evaluate your core revgen components, find the gaps, and provide recommendations on how to improve them.
All in a single two-week sprint.
“Nick’s research-driven approach and deep understanding of the agency space were instrumental in helping us develop our go-to-market strategy.”
State of the Digital Agency
Sizing the Digital Agency Industry
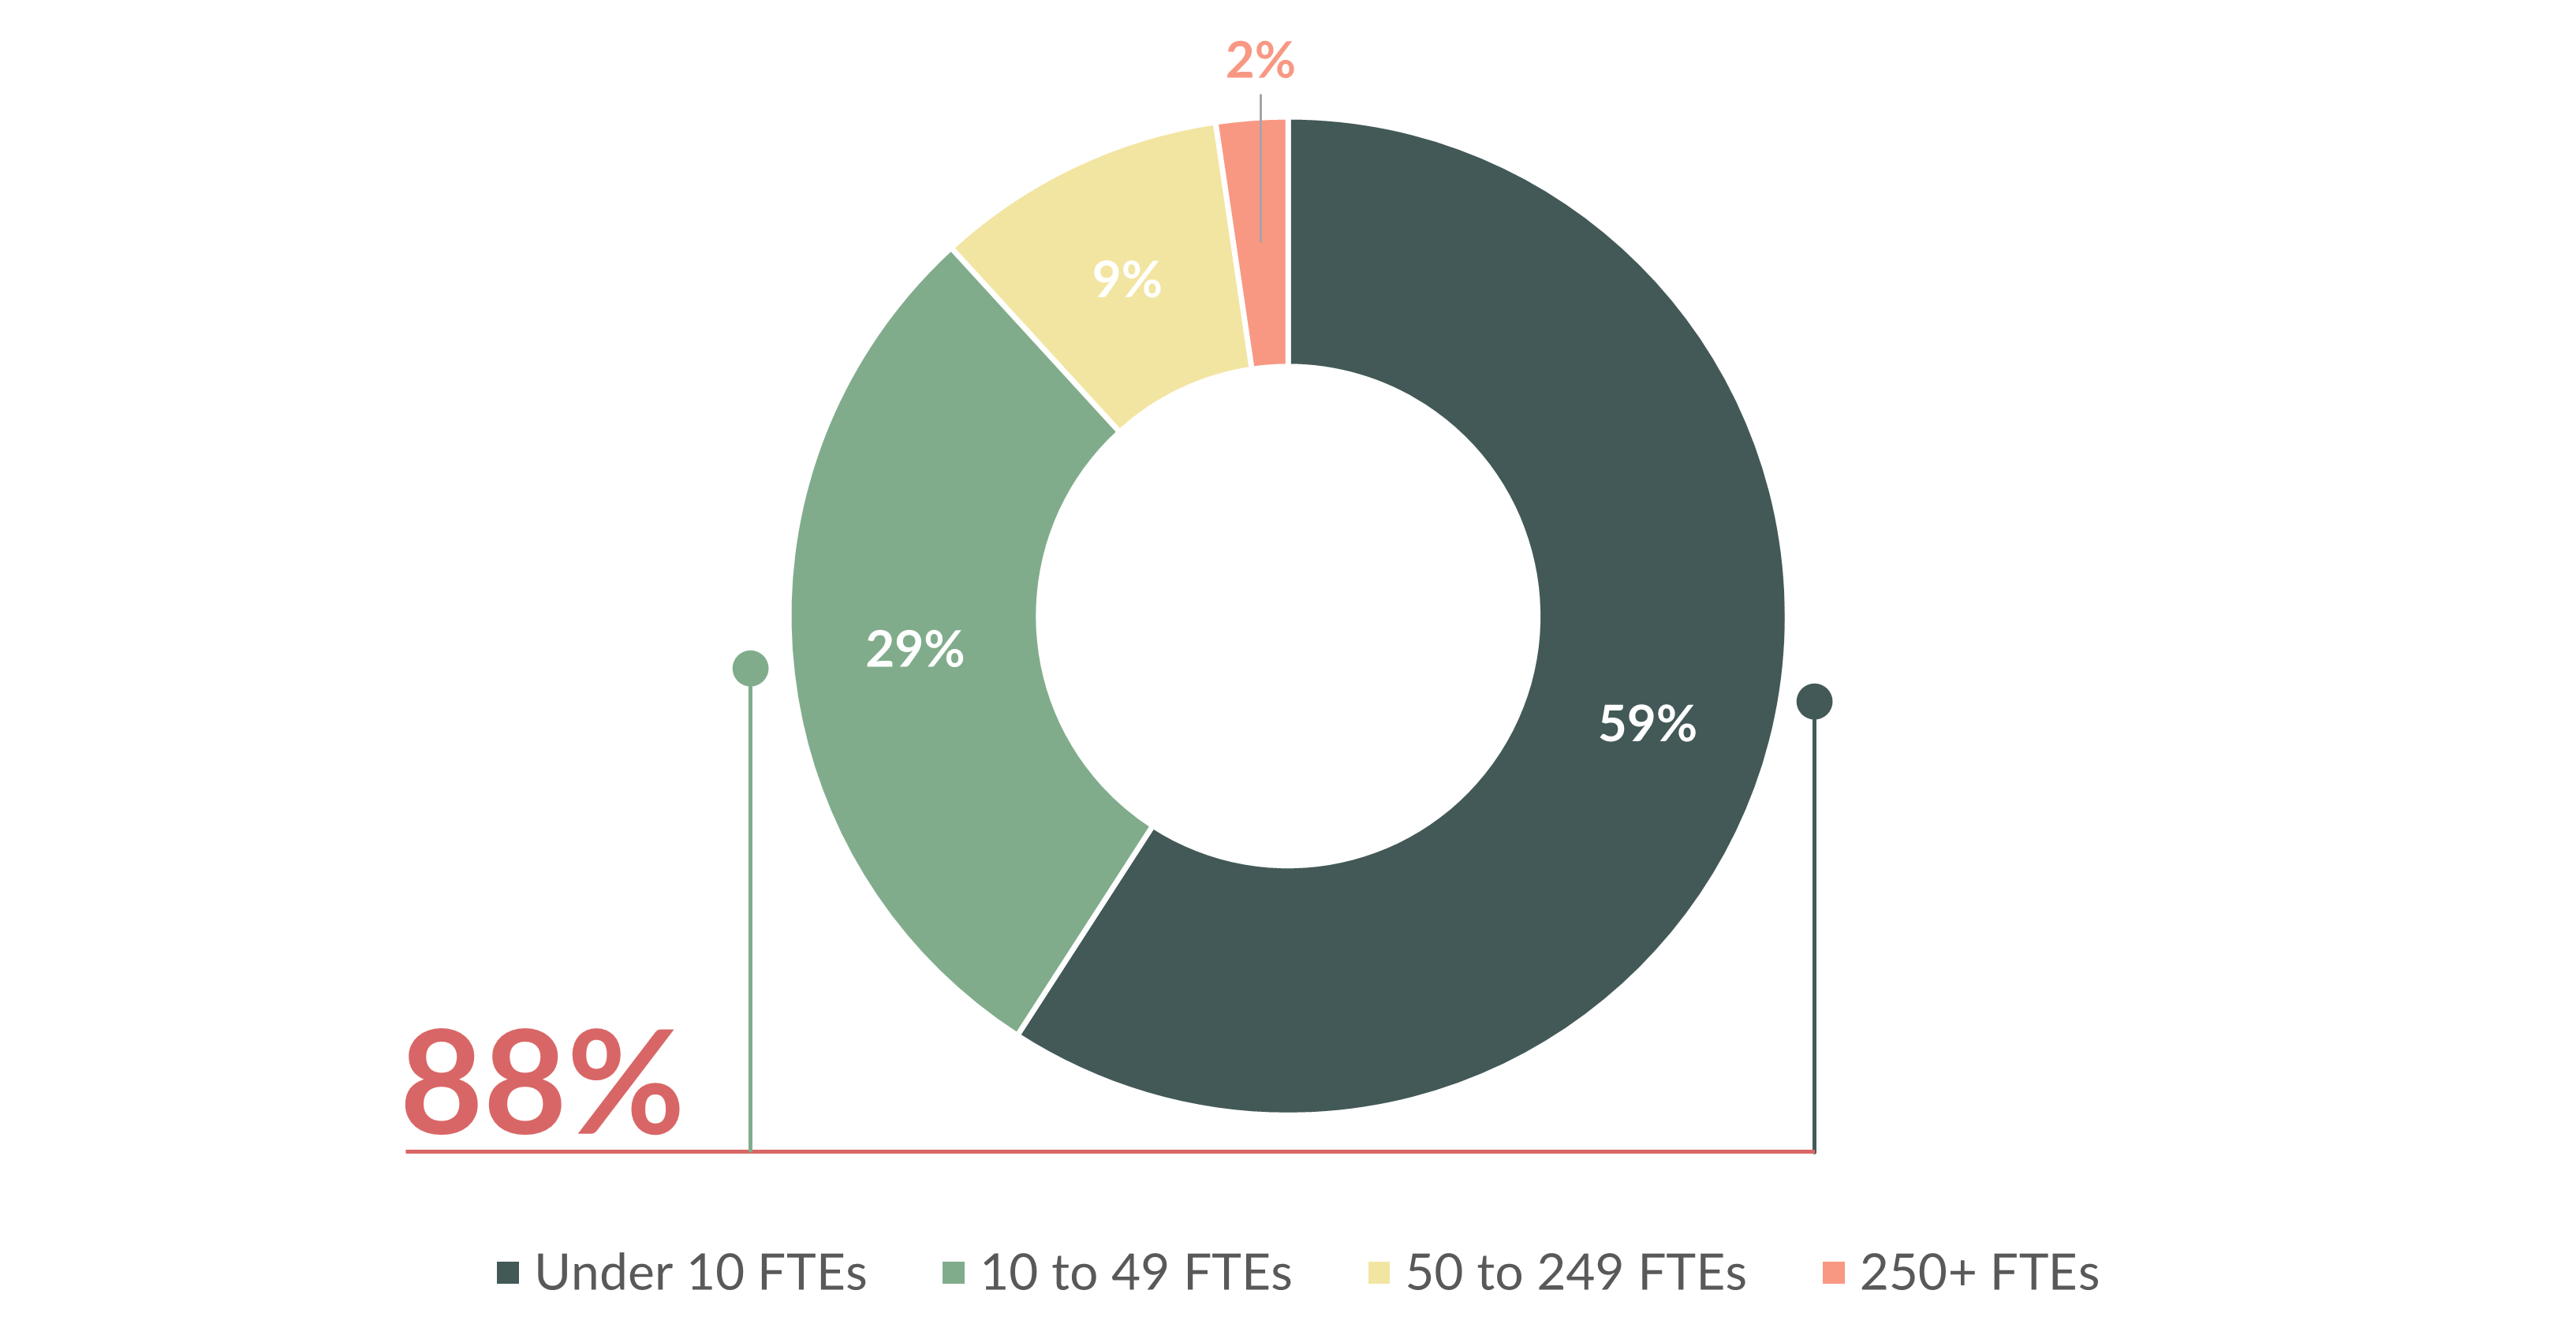
Digital Agency Size Cohorts by Full-time Employees in the United States and Canada
Source: Promethean Research
In our latest checks, we have counted over 50,000 digital agencies in the United States and Canada and over 179,000 worldwide.
The average size of a digital agency is tiny, with fewer than 10 full-time employees. In fact, 88% of the industry is comprised of shops that have fewer than 50 full-time employees.
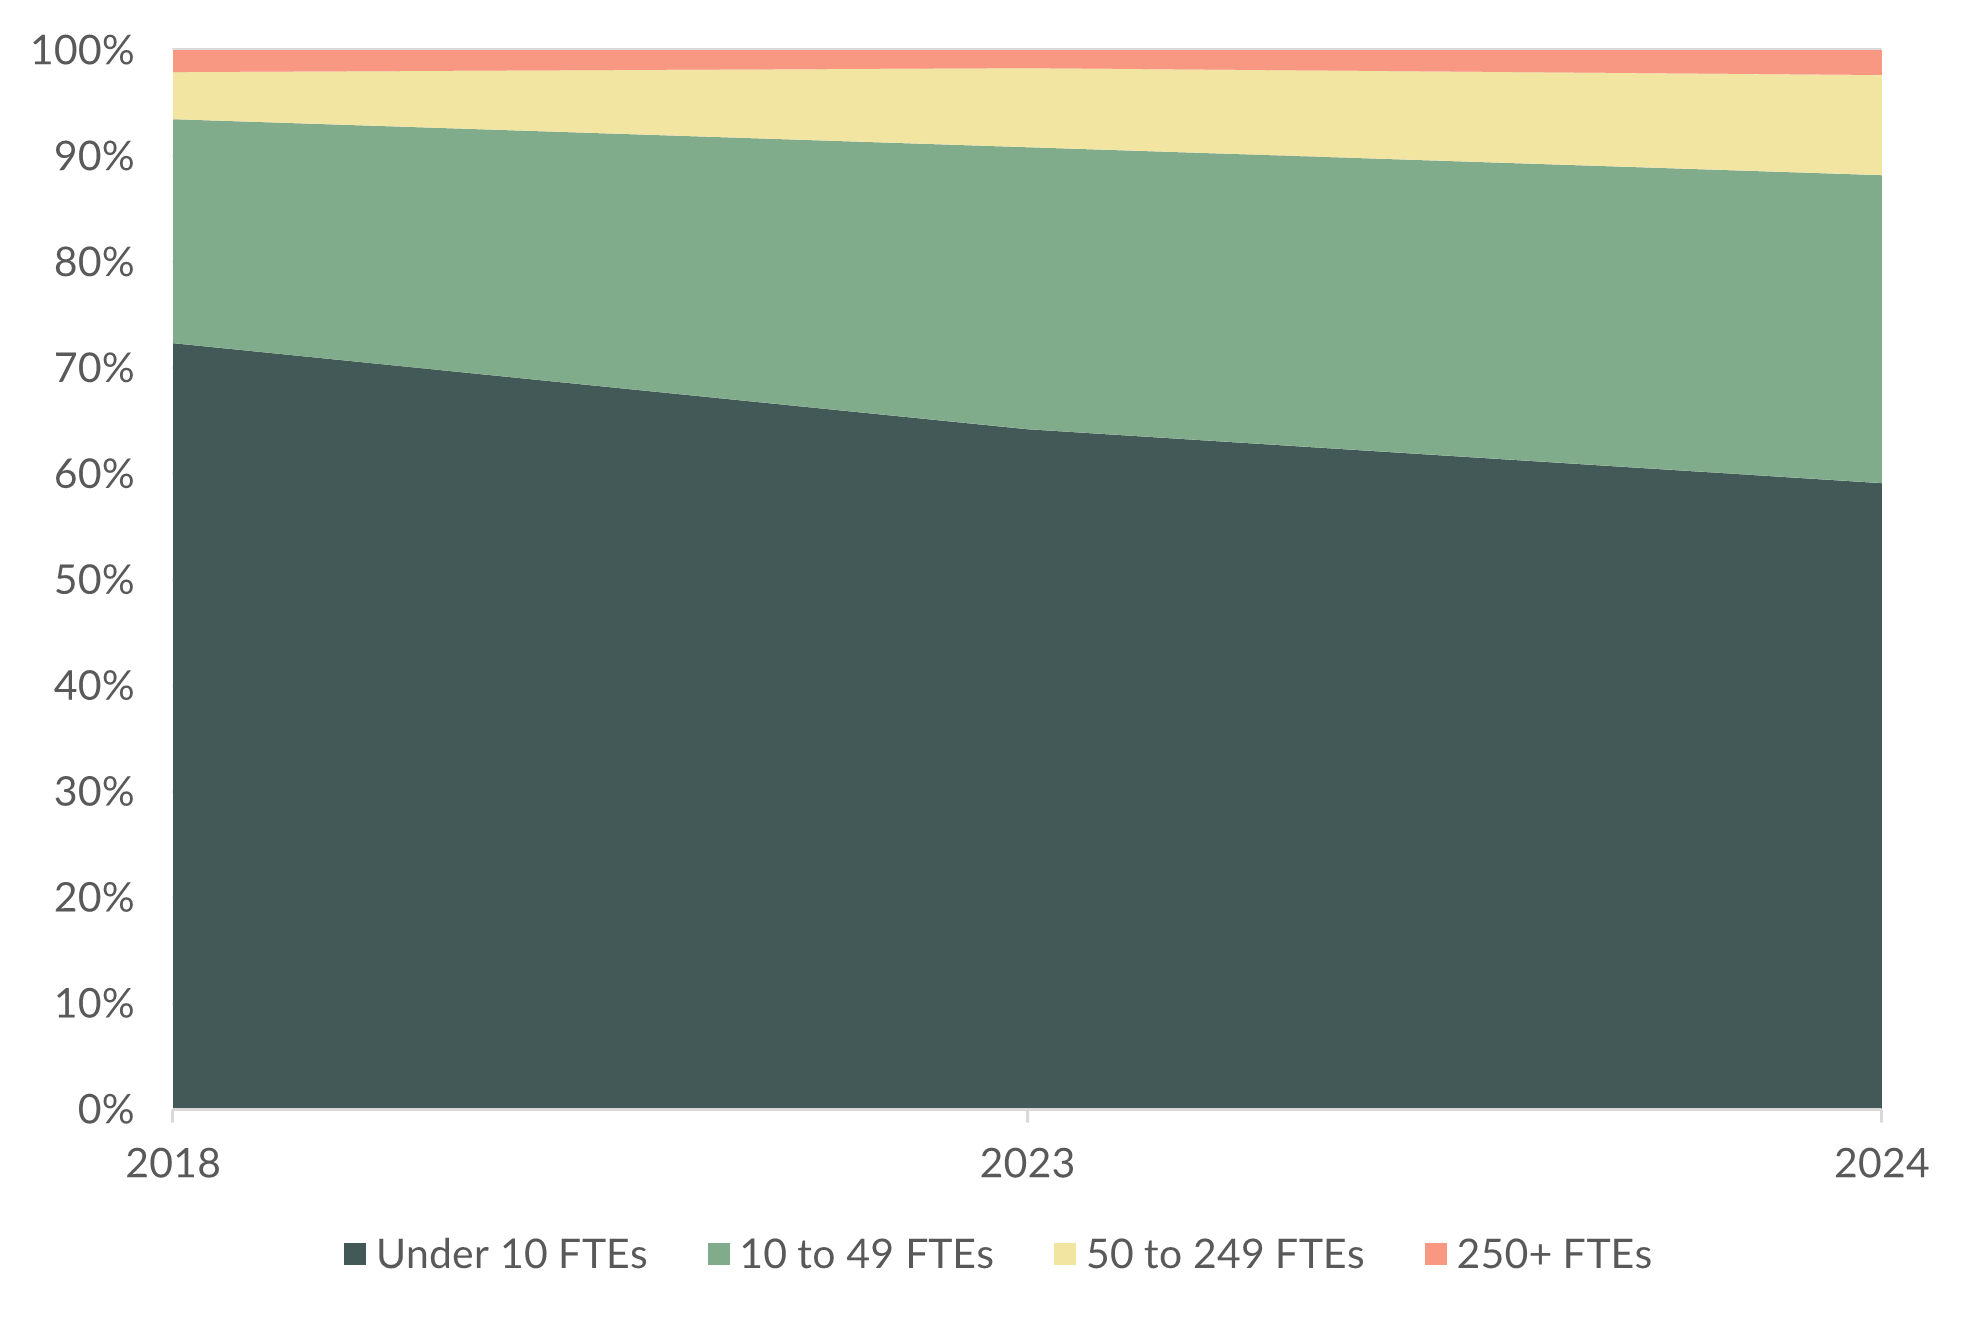
Change in Digital Agency Size Cohorts by Full-time Employees in the United States and Canada
Source: Promethean Research
The industry as a whole has shifted since 2018, away from the under-10 FTEs, and toward larger agencies with 10-249FTEs.
The small and medium-sized firms (<50 and 51-150 employee firms) are typically single agencies that can offer more services as they become larger with respect to revenue. The smaller agencies tend to be specialty shops, while the medium-sized firms tend to be more full-service. Then the larger firms return to specializing, primarily based on the industries served.
Most Enterprise firms (>250 employees) in this industry are structured as agency holding companies. These parent firms own multiple agencies, each focused on different specialties. By distributing clients across their portfolio, they can serve companies within the same industry, even direct competitors, without conflict. This setup allows them to avoid exclusivity issues while still delivering a range of creative solutions.
Industry History
The 1990s
Digital agencies really became a thing during the 90s as the internet itself began to take off.
Businesses realized they could sell more widgets with a web presence, and the people who could make that happen started leaving the web teams they ran inside traditional ad agencies and started some of the first digital agencies.
The dot-com boom accelerated this until the bubble burst in 2000, but brands already had a taste of what digital could do, and they knew agencies were the key to unlocking it.
This was the first example of a new technology creating business demand for services from digital agencies. As you’ll see throughout this section, this is the key reason why digital agencies exist, and it still impacts the industry today.
2000-2010
The new tech that heralded web 2.0 was a massive driver of agency growth during the early 2000s.
Platforms like Blogger, WordPress, and TypePad allowed agencies to offer content marketing and blogging services.
Facebook’s launch and rapid expansion revolutionized digital marketing by making social media valuable to businesses.
YouTube established video as another viable marketing channel and allowed agencies to leverage video on a massive scale.
Collectively, these social technologies expanded agency offerings and fundamentally changed how digital agencies delivered value.
Again, this was another decade where new tech provided fuel to grow existing agencies and spawn thousands of new ones.
2010-2020
Between 2010 and 2020, several new technologies emerged that massively impacted digital agencies. This is where dev, design, and marketing truly began to mix, since each discipline was needed to be successful here.
The rise of smartphones and tablets created demand for responsive web designs and apps.
Platforms like HubSpot, Marketo, and Pardot became essential agency tools for automating marketing tasks.
And programmatic advertising emerged and changed how brands bought ads.
Finally, everything from the 90s and 2000s was still growing. A ton of businesses were still building their first sites, while many were doing full site redesigns. Blogging experienced massive growth, social was everywhere, and video exploded with livestreaming and television coming to the web.
All these tech advancements made it almost impossible to fail at growing an agency. Growth was everywhere.
2020-2024
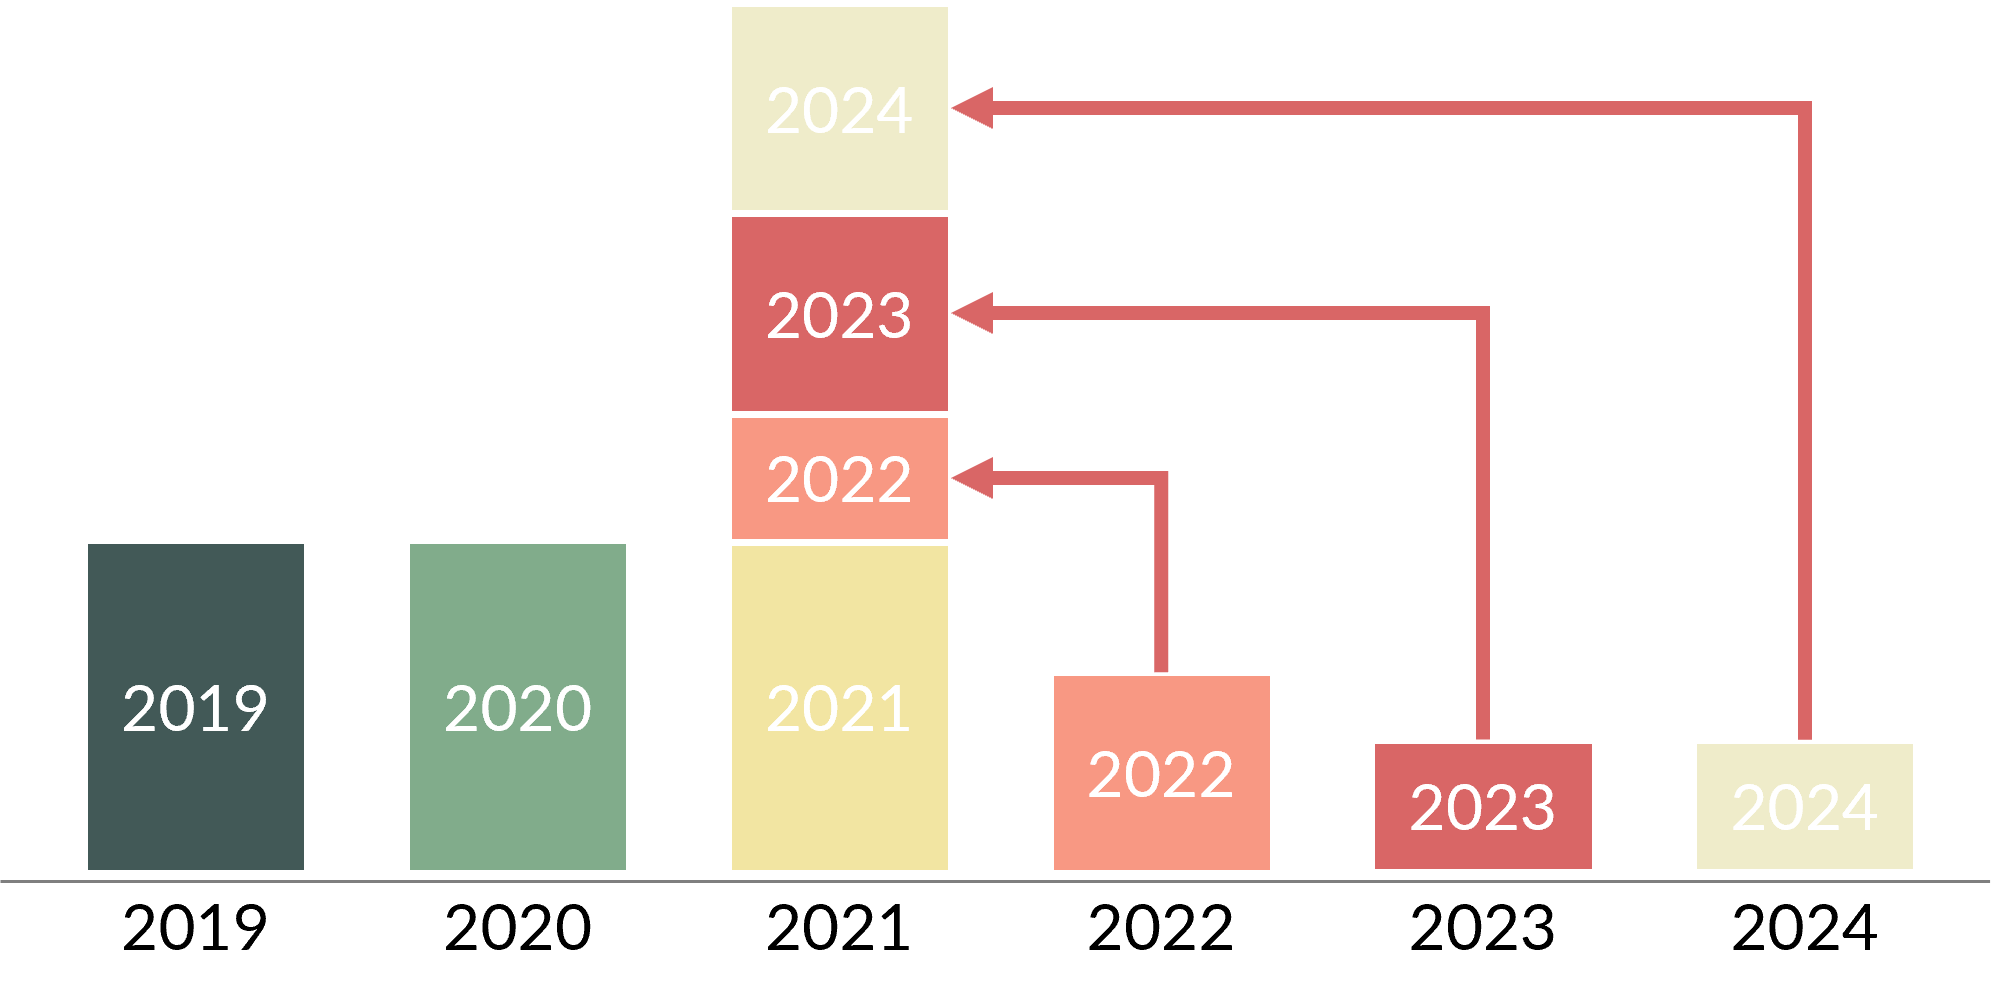
Pull-forward in Digital Investment by Brands
Source: Promethean Research
Then 2020 hit. Spending came to an absolute standstill in the first half of that year. Projects were paused. Sales pipelines went dry. And layoffs were common.
Then, midway through the year, the U.S. government launched the PPP and EIDL programs, which pumped about a trillion dollars into the US economy. That, plus a Fed Funds rate of 0%, threw the economy into overdrive.
The world was still in lockdown, and this meant that if brands were going to survive, they had to do it digitally. They went hard into digital investments across the board and pulled forward years of investments throughout 2021. Digital agencies of all kinds rode this renewed wave, with many growing faster than ever. The major challenge agency owners faced in early 2022 was competing with product companies for talent.
We got some vaccines, and the world reopened that year, but inflation and interest rates began to rise. Then, brands pulled back spending.
While 2022 started with agencies fighting over talent, it ended with shops staring down weak sales pipelines. This weakness continued throughout 2023 and didn’t stabilize for many until partially through 2024.
Layoffs and downsizing were commonplace once again. This was the first time in 20-some years where new tech wasn’t the key driver of agency growth. Agencies were at the mercy of general economic conditions, and not even the introduction of a tech like AI could spark life into a tough agency market.
How Agencies Are Structured
Four Functions of a Digital Agency
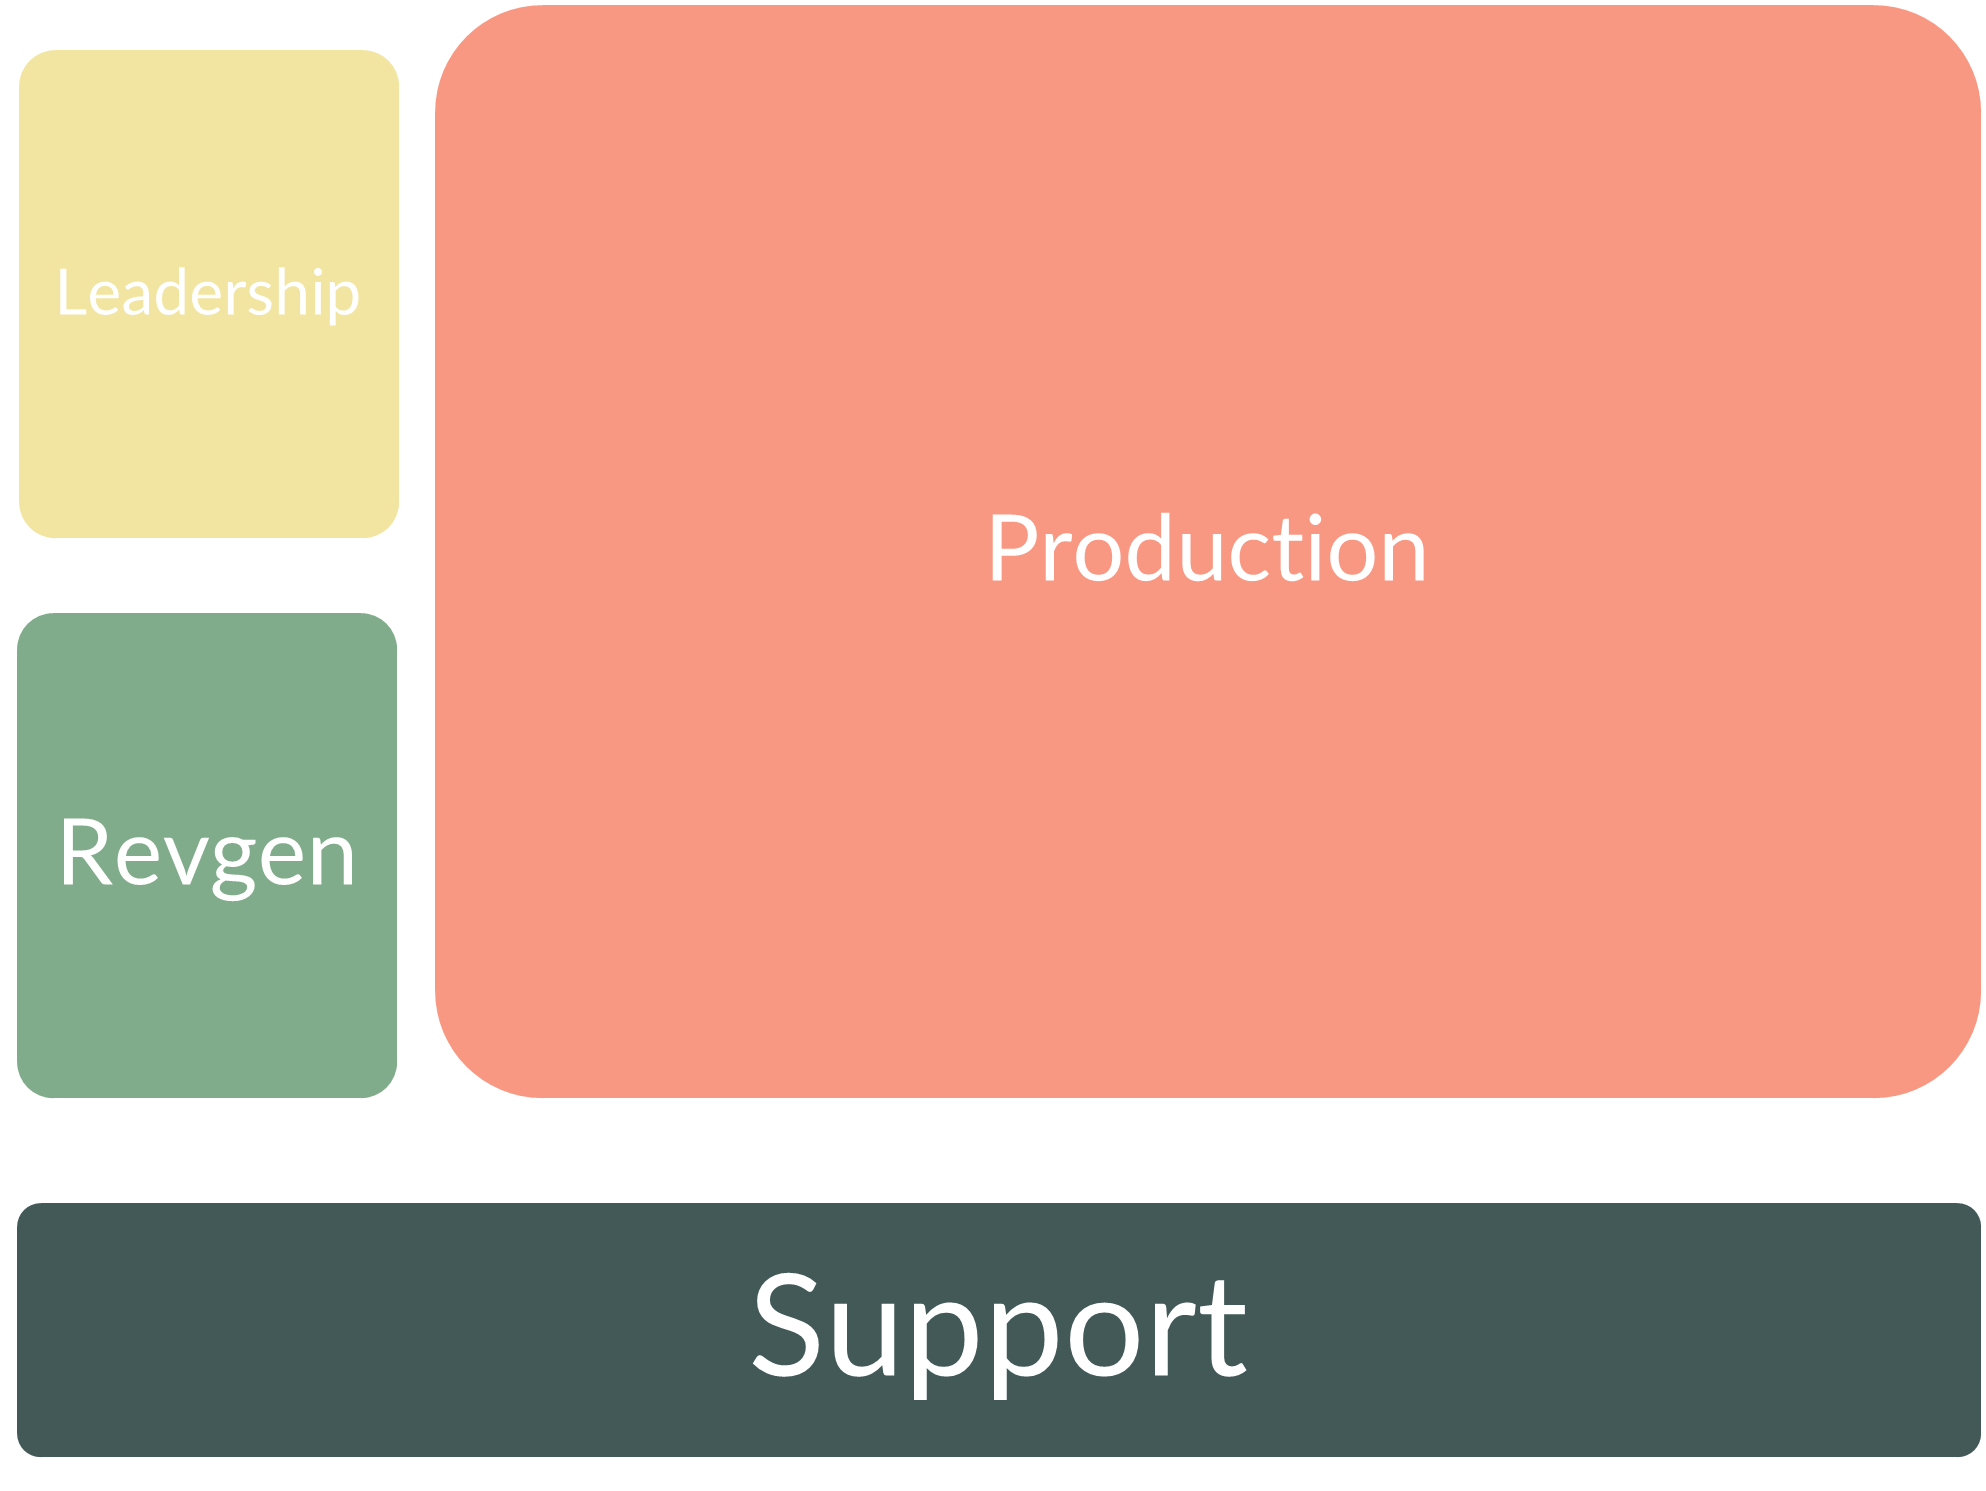
Core Agency Functional Areas
Source: Promethean Research
The structure of a digital agency has remained largely consistent over time. We evaluate them by segmenting agencies into four core functional areas: Revenue Generation (Revgen), Production, Support, and Leadership.
Revgen is responsible for bringing in business. This includes marketing, sales, business development, and account management, basically everything tied to generating and growing revenue.
Production is tasked with delivering the work that Revgen sells. This group includes developers, designers, marketers, copywriters, project managers, and others responsible for executing client projects. Many agencies refer to this function as “delivery.”
Support roles keep the business running smoothly. This includes functions like accounting, HR, legal, and general operations.
Leadership sets the overall direction for the agency by defining the mission, vision, and strategic goals that guide everything else.
How Roles Evolve as Agencies Grow
When agencies are small (<10 FTE), owners typically cover most of the core functions themselves. They manage revenue generation, handle a large share of production, and lead the business. While owners play a large role in support functions, most are supported by outside vendors until the firm grows.
As the agency scales, it begins hiring dedicated staff to take over roles that were previously handled by the owners, outsourced, or ignored altogether.
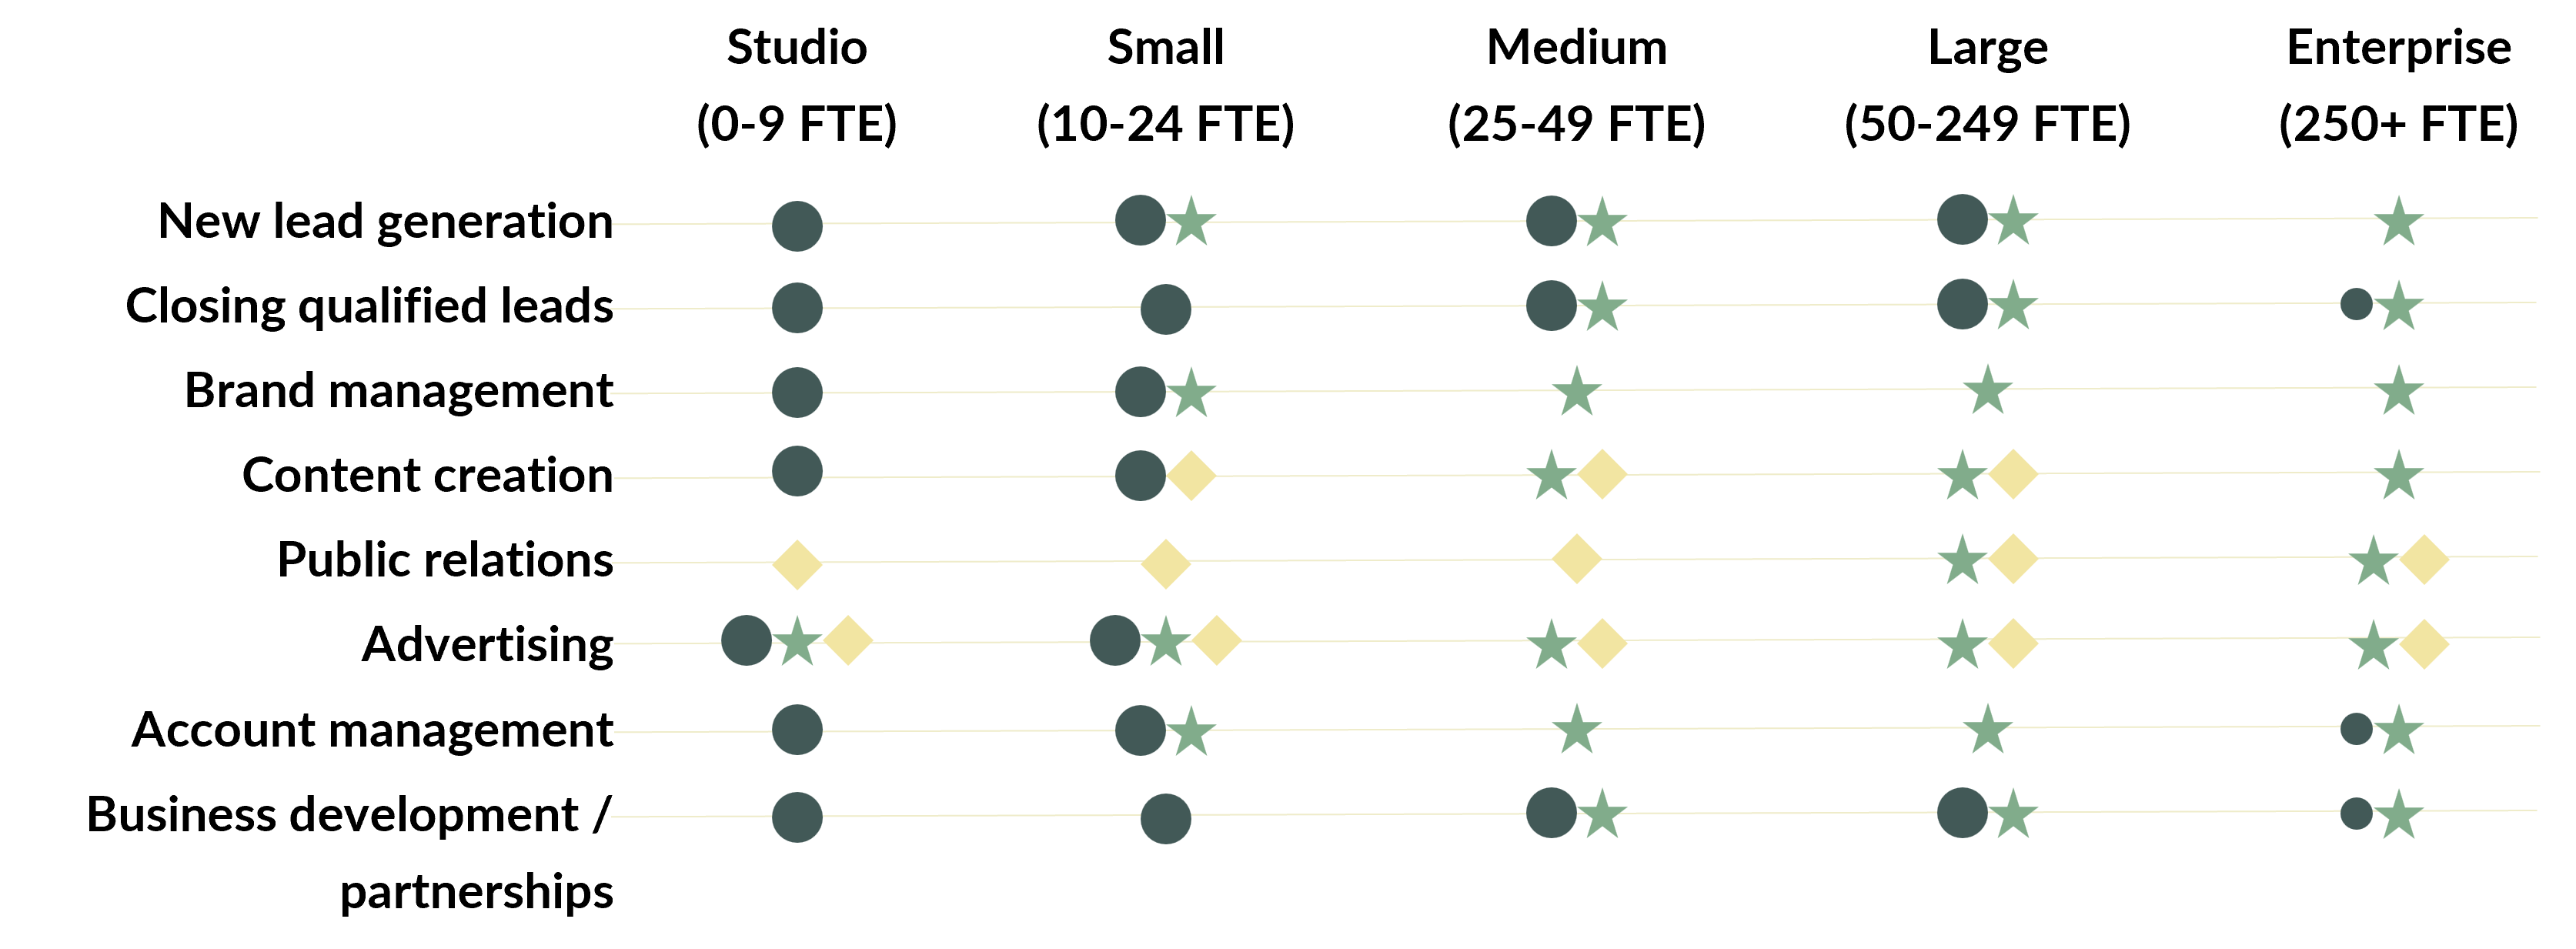
What follows is a breakdown of how agency size influences who handles different roles, owners/partners, employees, or outsourced vendors. For each activity, we show how responsibility shifts as the agency grows. When multiple dots appear, it means the role is commonly handled in more than one way at that size.
Next, we’ll take a look at the relationship between the size of a firm and when they’ll bring on a dedicated employee or vendor to handle various roles.
Revenue Generation Roles
Here, you can see how the revgen roles are typically staffed for varying agency sizes.
What’s interesting about the revgen duties is that partners are almost always involved in revgen in some capacity. Even at the largest agencies, they’ll still come in to help get key accounts across the finish line.

Revgen Role Evolution
Source: Promethean Research
Production / Delivery Roles
Almost the opposite of revgen, the partners tend to replace themselves in the production area rather quickly.
Sometimes, we’ll see partners remain involved in production tasks at larger agency sizes, but this isn’t a healthy practice. Once an agency grows beyond about 25 employees, there’s too much other work for a partner to do that takes priority over production tasks.
Note that in recent surveys, we’ve seen a significant uptick in the use of contractors across most agency sizes. This increase is likely driven by agencies looking to maintain capacity levels while managing utilization rates in a challenging sales environment. Should this trend continue, we expect it to have significant implications for agency structure, culture, and effectiveness.
Production / Delivery Role Evolution

Source: Promethean Research
Support Roles
Support services are some of the most commonly outsourced parts of an agency. There’s an argument for some of these to be brought in-house, but unless you can really derive some kind of advantage from doing so, outsourcing a lot of these makes sense.
Support Role Evolution

Source: Promethean Research
Leadership Roles
Finally, the leadership section is almost always fully staffed by partners. It isn’t until the larger sizes that employees are brought in to aid the partners in leadership tasks. Then, at the enterprise level, it’s more common for the c-suite to be staffed by employees rather than partners.
Leadership Role Evolution

Source: Promethean Research
Revenue, Pricing & Profitability Benchmarks
Average Agency Revenue Growth
Average Annual Digital Agency Revenue Growth
Source: Promethean Research
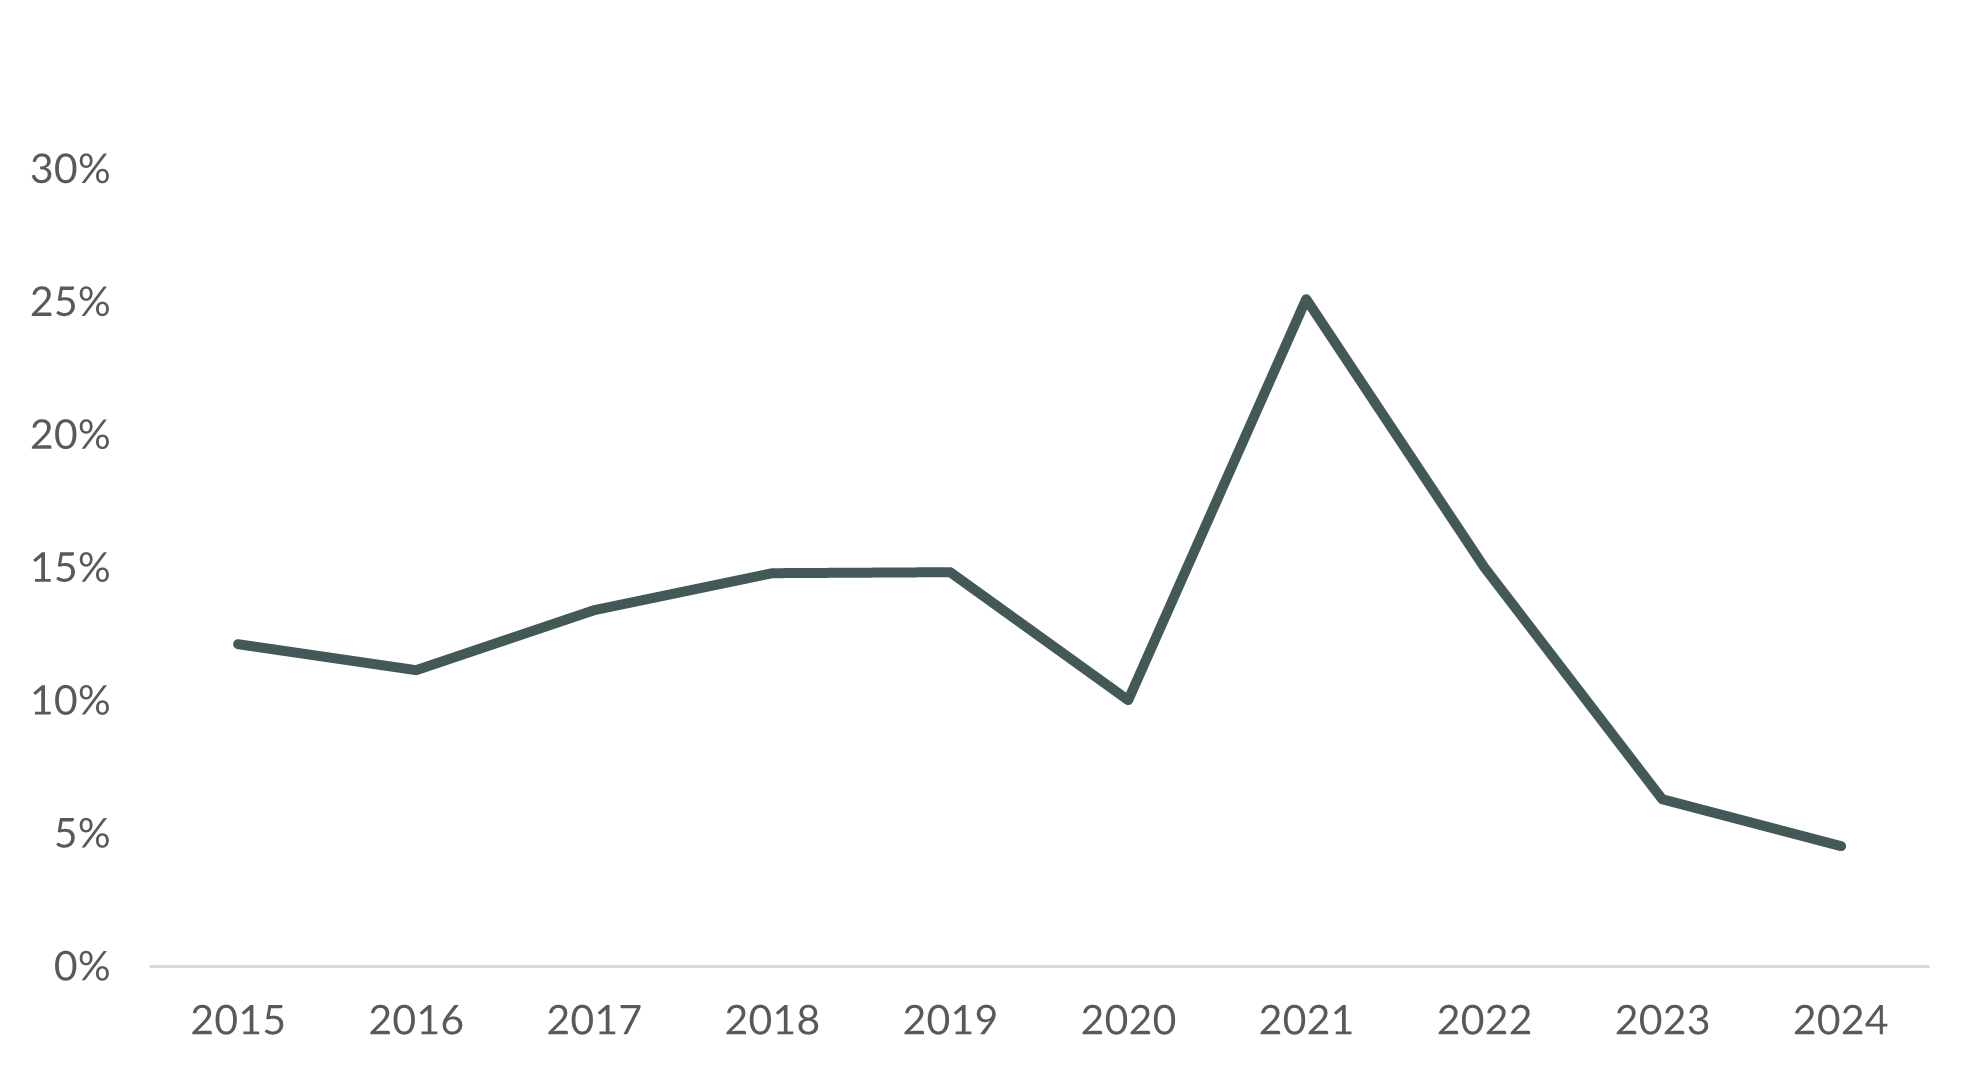
Overall, digital agencies tend to grow slightly faster than other industries. The average annual growth rate for digital agencies in our surveys over the last five years has been 12%. The average annual growth rate for all U.S. publicly traded sectors has been about 10%
We can see the massive pull-forward in digital transformation and marketing spend initiated during the pandemic play out in the growth rates. Agencies grew at a stable rate from 2015 to 2019, then experienced a dip in 2020, and then in 2021, the average growth rate skyrocketed.
In ‘22, growth slowed back to average, and in ‘23, it fell even further. Our latest figure for ‘24’s average growth rate is just 5%. So, while agencies tend to grow faster than average, the last few years haven’t been kind to the industry.
Hourly Rates
Average Digital Agency Hourly Rates
Source: Promethean Research
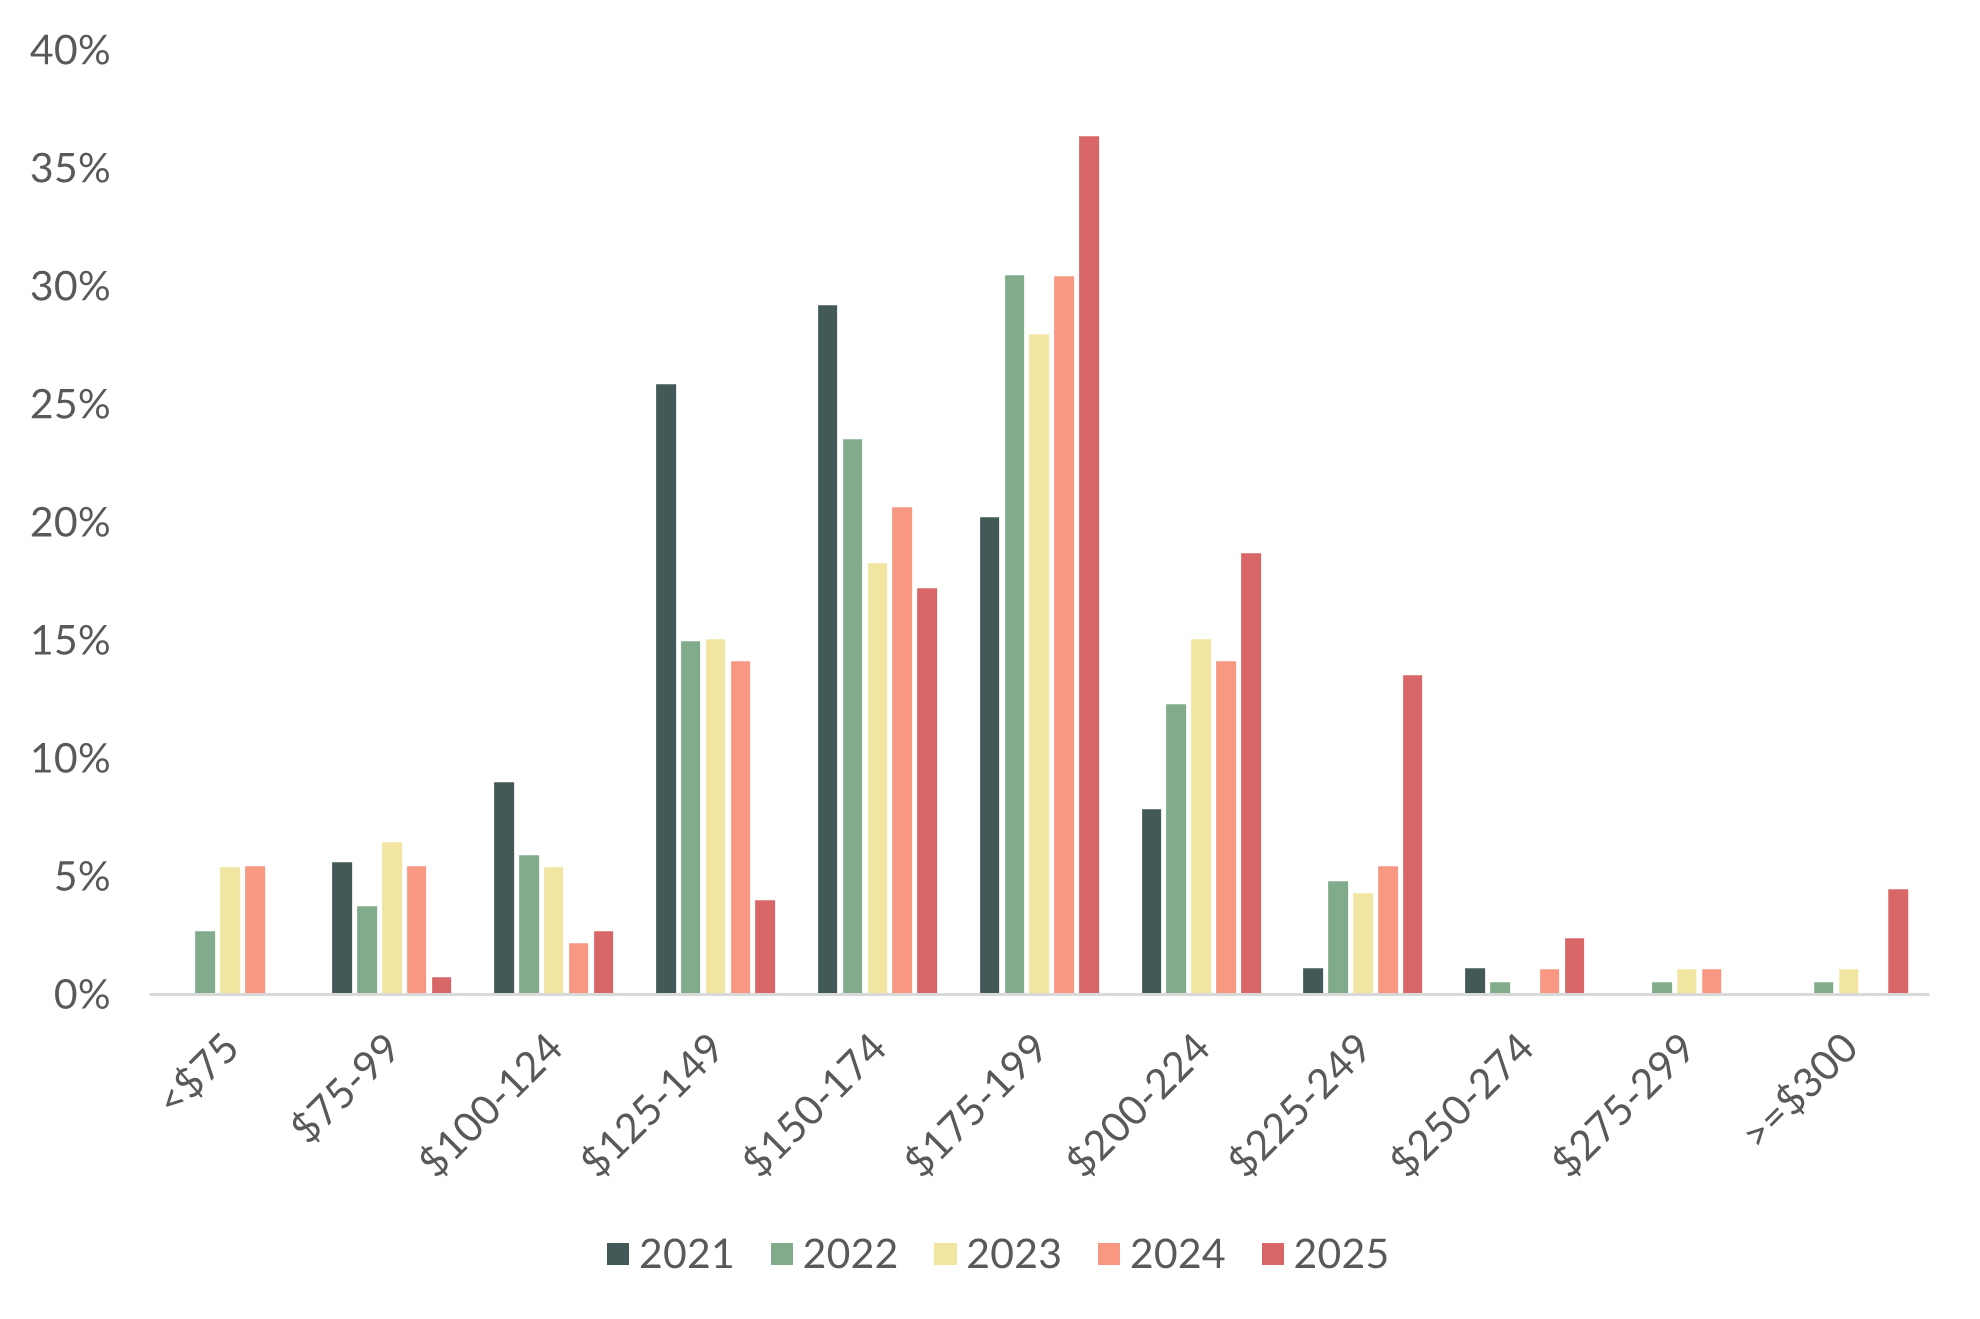
Pricing was a huge discussion point throughout 2021 and ‘22, but as pipelines dried up in 2023, much of the mad dash to raise rates slowed. 22% of the agency leaders in our survey reported an increase in their agency’s hourly rate from 2023 to 2024. This is almost half the amount that reported raising their rates from 2022 to 2023. 28% of agencies raised prices from 2024 to 2025.
A third (36%) of digital agencies in our latest survey charged between $175-199/hr., while another third (32%) charged between $200-249/hr.
Digital agencies are clearly still raising rates.
Most Common Pricing Methods
Agency Pricing Methods
Source: Promethean Research
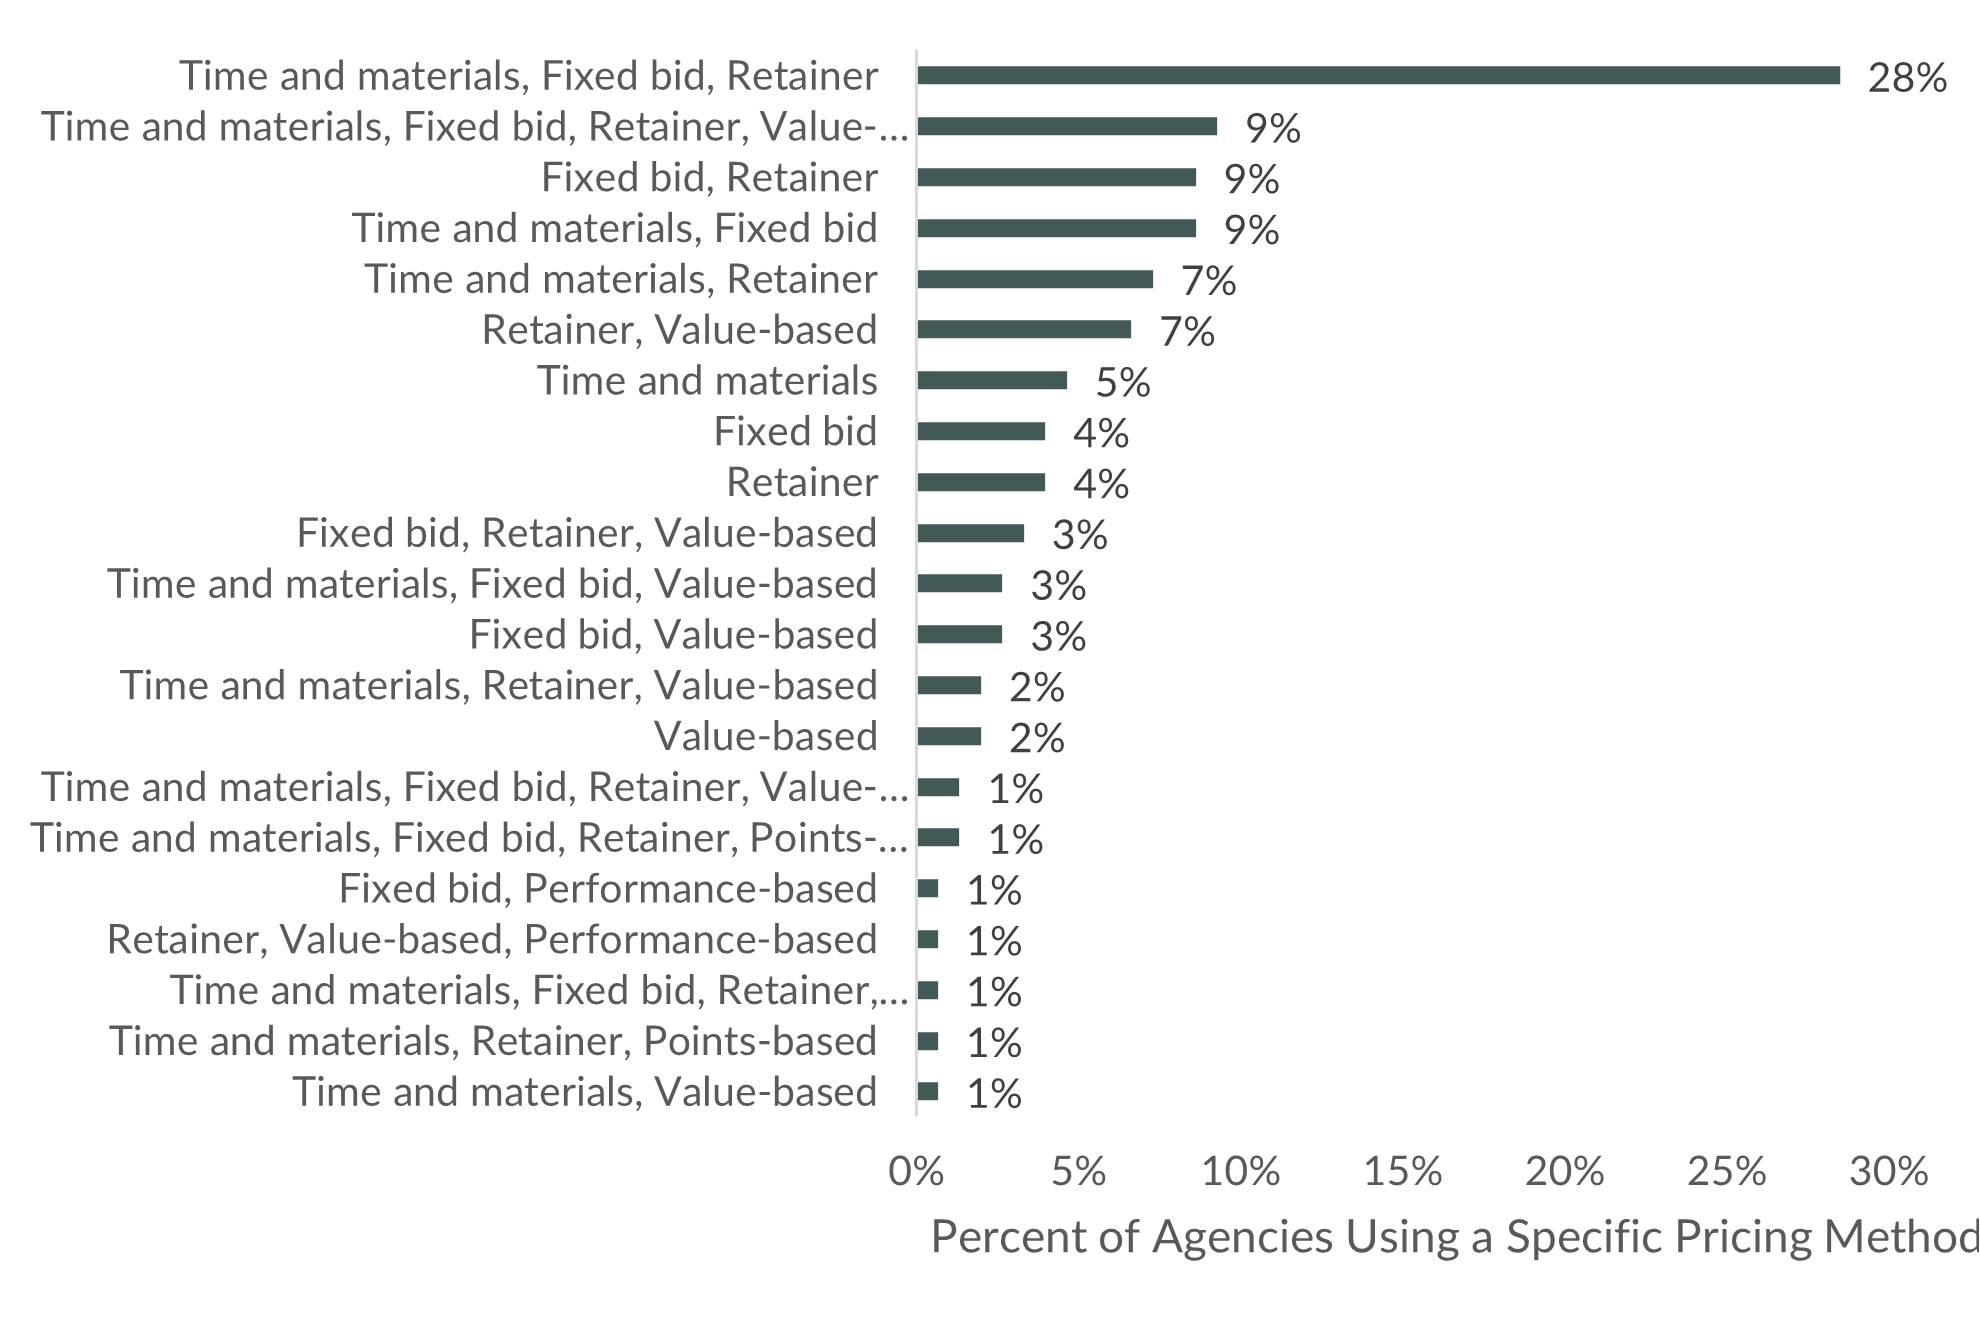
Most digital agencies use a mix of pricing methods. The most common is a mix of Time and materials, Fixed bid, and Retainer. Only 4% or fewer rely on any single model exclusively (e.g., “Fixed bid” or “Retainer” alone).
This suggests that agencies are tailoring their pricing methods to fit different types of work, client preferences, or project risk levels.
Pure Value-Based pricing is used by only 2% of agencies, and any model involving Performance-Based pricing appears in just 5% of responses (combined across all mixes).
Pricing Methods
Fixed Fee / Project
This model estimates the cost of a project and then adds a margin to arrive at a fixed fee that the client pays. Clients tend to like it because it gives them a reliable number to budget against. Efficient agencies tend to like this because it can let them charge a higher rate than they might be able to charge hourly. The bulk of the risk of these engagements lies with the agency, as scoping inaccuracies can easily erode margins.
This model is most appropriate when scopes are predictable and well-defined.
Value-based
Pricing services based on the expected value that an agency’s work generates for a client is the goal for most agencies as it aligns the agency’s and client’s goals more than the fixed-fee model and can generate substantial profits for the agency. Agencies typically experience pushback when selling this model, as value-based prices can be much higher than cost-plus pricing.
This model is best employed by experienced, proven agencies that can quantify success for high-stakes projects. It sets the agency up as more of a strategic partner vs. a vendor.
Hourly / Time & Materials
This is the simplest pricing model and is often employed by firms in their early stages. Here, agencies price their services based on the costs and time required to perform those services and then bill on a periodic basis based on the time incurred. There can be a blended “firm-wide” hourly rate charged or different rates based on the skill level of the individuals working on the project. The client bears most of the risk here, as scoping overages require extra hours to address.
This model is most appropriate for unpredictable scopes.
Performance-based
This is where agencies (typically marketing agencies vs. dev or design) charge a fee based on the change in a particular performance metric that they influence. This metric is often sales, but it could also be something more targeted that the client’s measuring like page views, social engagement, leads generated, etc. Performance-based pricing strongly aligns the agency with the client’s tactical goals. The agency bears significant risk here as its earnings are based on its ability to execute and deliver results.
This method is used when there are clear, measurable metrics that the agency influences. It also tends to position the agency as a vendor vs. a strategic partner.
Average Agency Profitability
Average Digital Agency Profitability
Source: Promethean Research
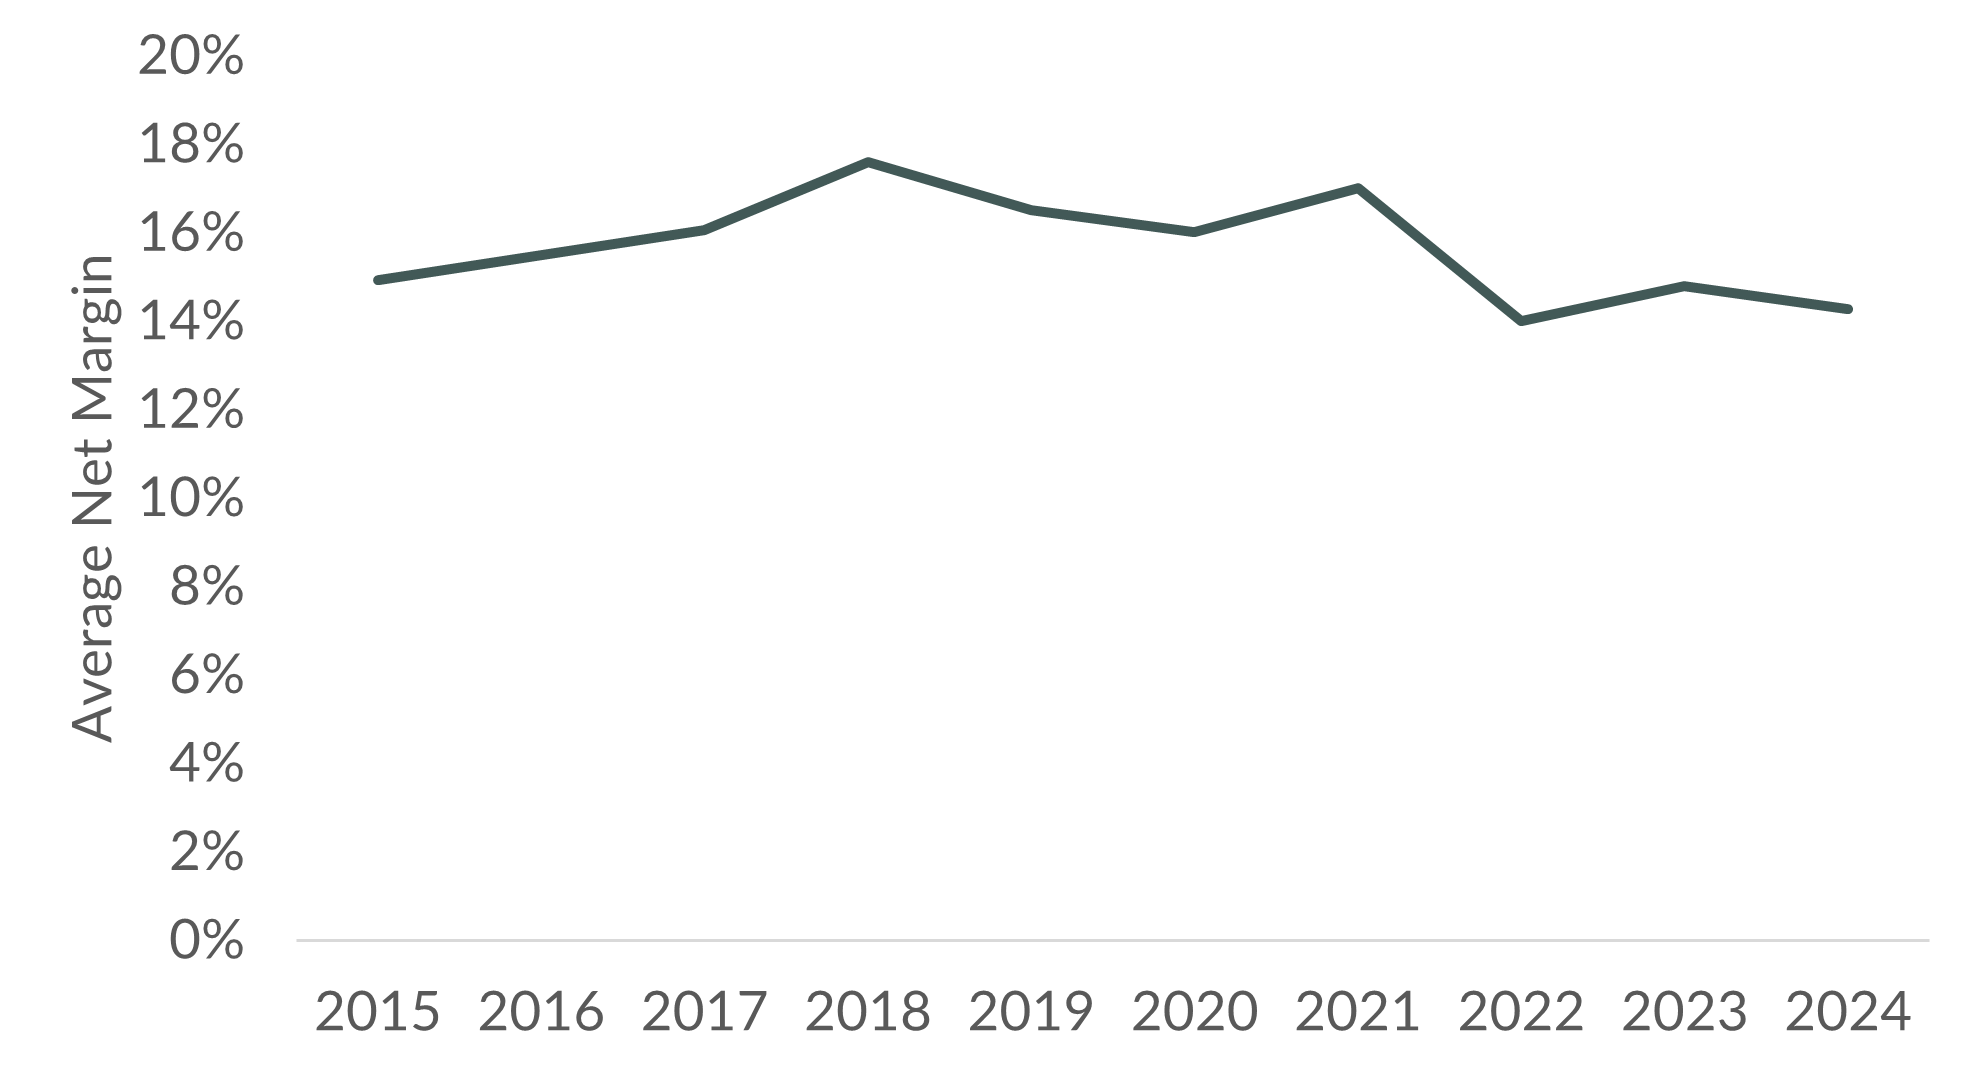
Agencies earn an average net margin of about 16% over this timeframe, but we’ve been running slightly below that for the past three years. This is especially interesting because of how dramatically growth has slowed recently. We’d expect to see a bigger hit to margins here, but in 2024, agencies once again showed impressive fiscal discipline and the average agency earned a net margin of 14%.
Average agency margins change as agencies grow. We wrote about this in more detail in our Digital Agencies Don’t Scale newsletter. Smaller agencies tend to earn higher net margins than larger ones. In 2014, Studio-sized agencies with fewer than 10 FTE earned an average margin twice as large as the average 50+ FTE agency.
Trends in Recurring Revenue
Popularity of Retainers
Source: Promethean Research
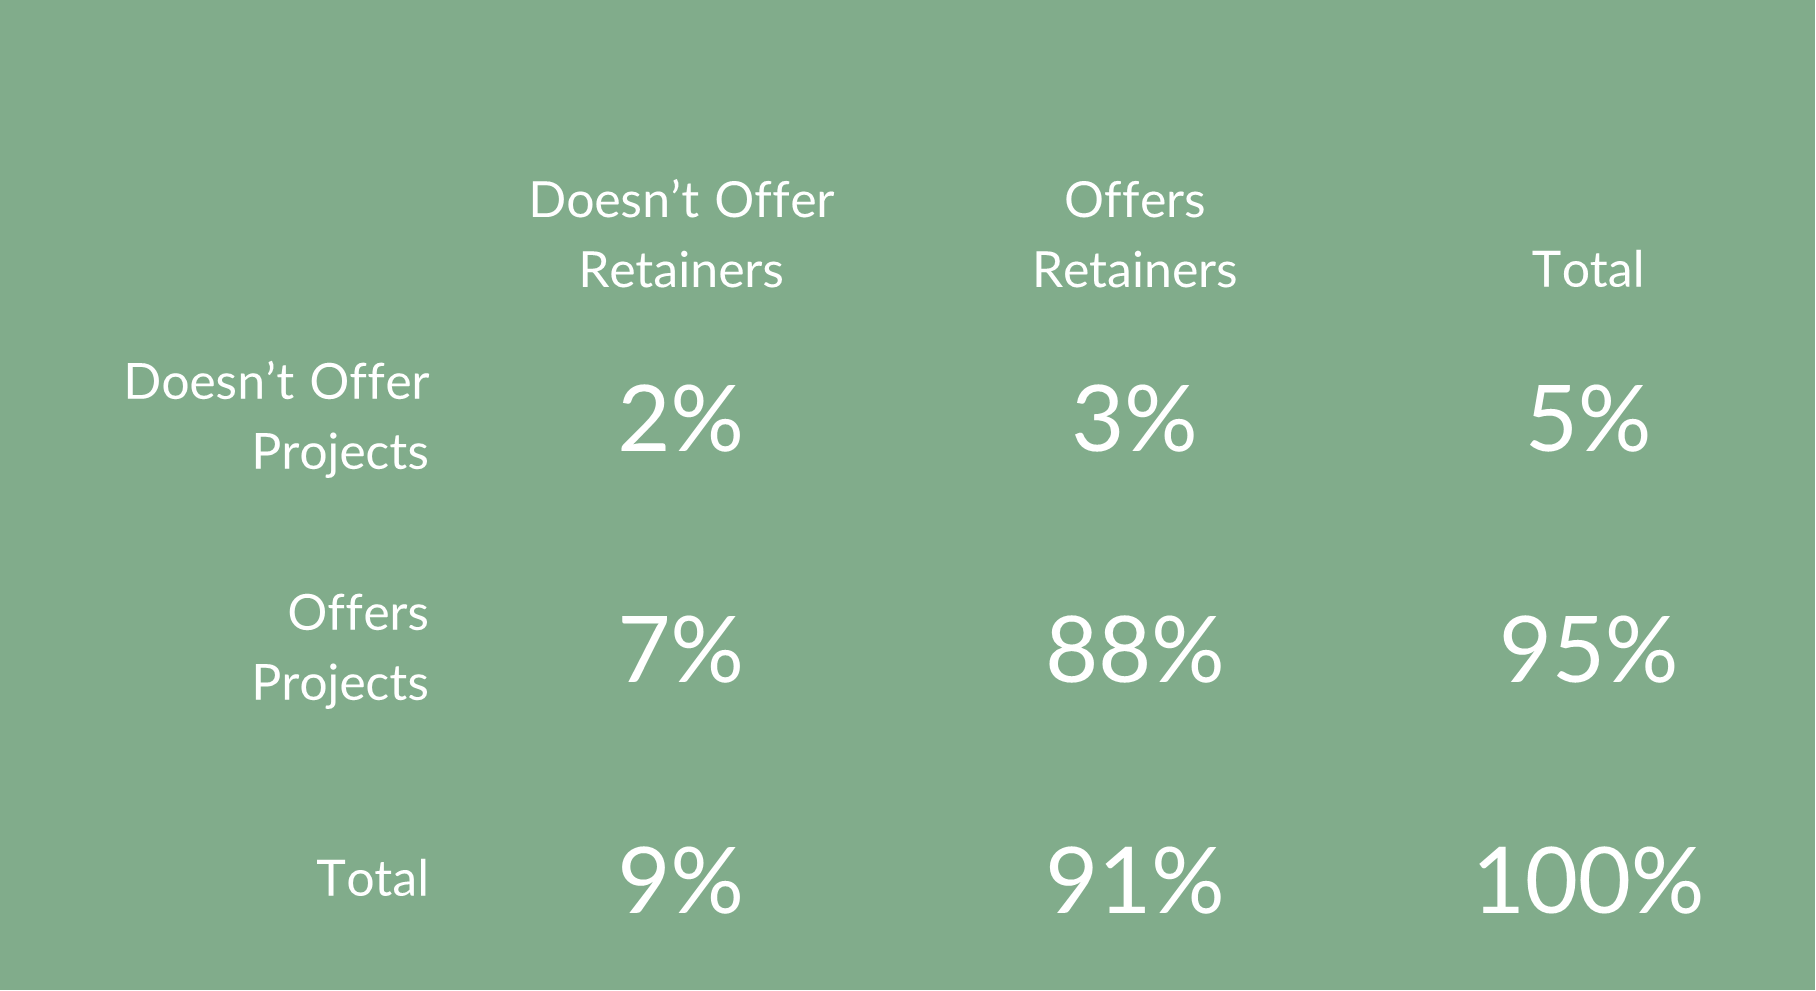
In our How Digital Agencies Grow Report, we found that most agencies generate revenue through a mix of projects and retainers. 95% offered projects, 91% offered retainers, and 88% offered both. It’s incredibly rare for an agency to offer only project-based or only retainer-based engagements.
Looking at how this impacted growth rates, we found that fast-growing agencies completed 24% more projects while serving 16% fewer retainer clients than average. This leads us to believe that recurring revenue can provide a good base, but it’s easier to grow faster when agencies focus on non-recurring project work.
Revgen Investment & Lead Sources
Average Investment in Sales & Marketing
Source: Promethean Research
The average digital agency allocates 7.1% of its revenue to sales and marketing. This includes everything from salaries to media spend. That level of investment, while common, typically falls short of what’s needed to hit leadership’s ambitious growth targets set during annual planning meetings.
Most agencies still generate the bulk of their leads and revenue through referrals. While referrals are a great way to get started, relying on them as the primary growth engine introduces several issues. First, they’re unpredictable. Second, they often come from people within the same network, which makes it harder to expand into new types of work or larger scopes. Third, you don’t control the quality of the referral, which can lead to mismatched expectations and strained relationships for poor-fit referrals.
To be clear: referrals aren’t the problem. They’re a valuable channel. But what sets agencies apart as they grow beyond the 30-50-person plateau is the development of a repeatable revenue generation engine. If this is referral-based, it needs to be a systematized approach to consistently generate right-fit referrals.
Shifts in Digital Agency Services
Changing Focus
Popularity of Digital Agency Services
Source: Promethean Research
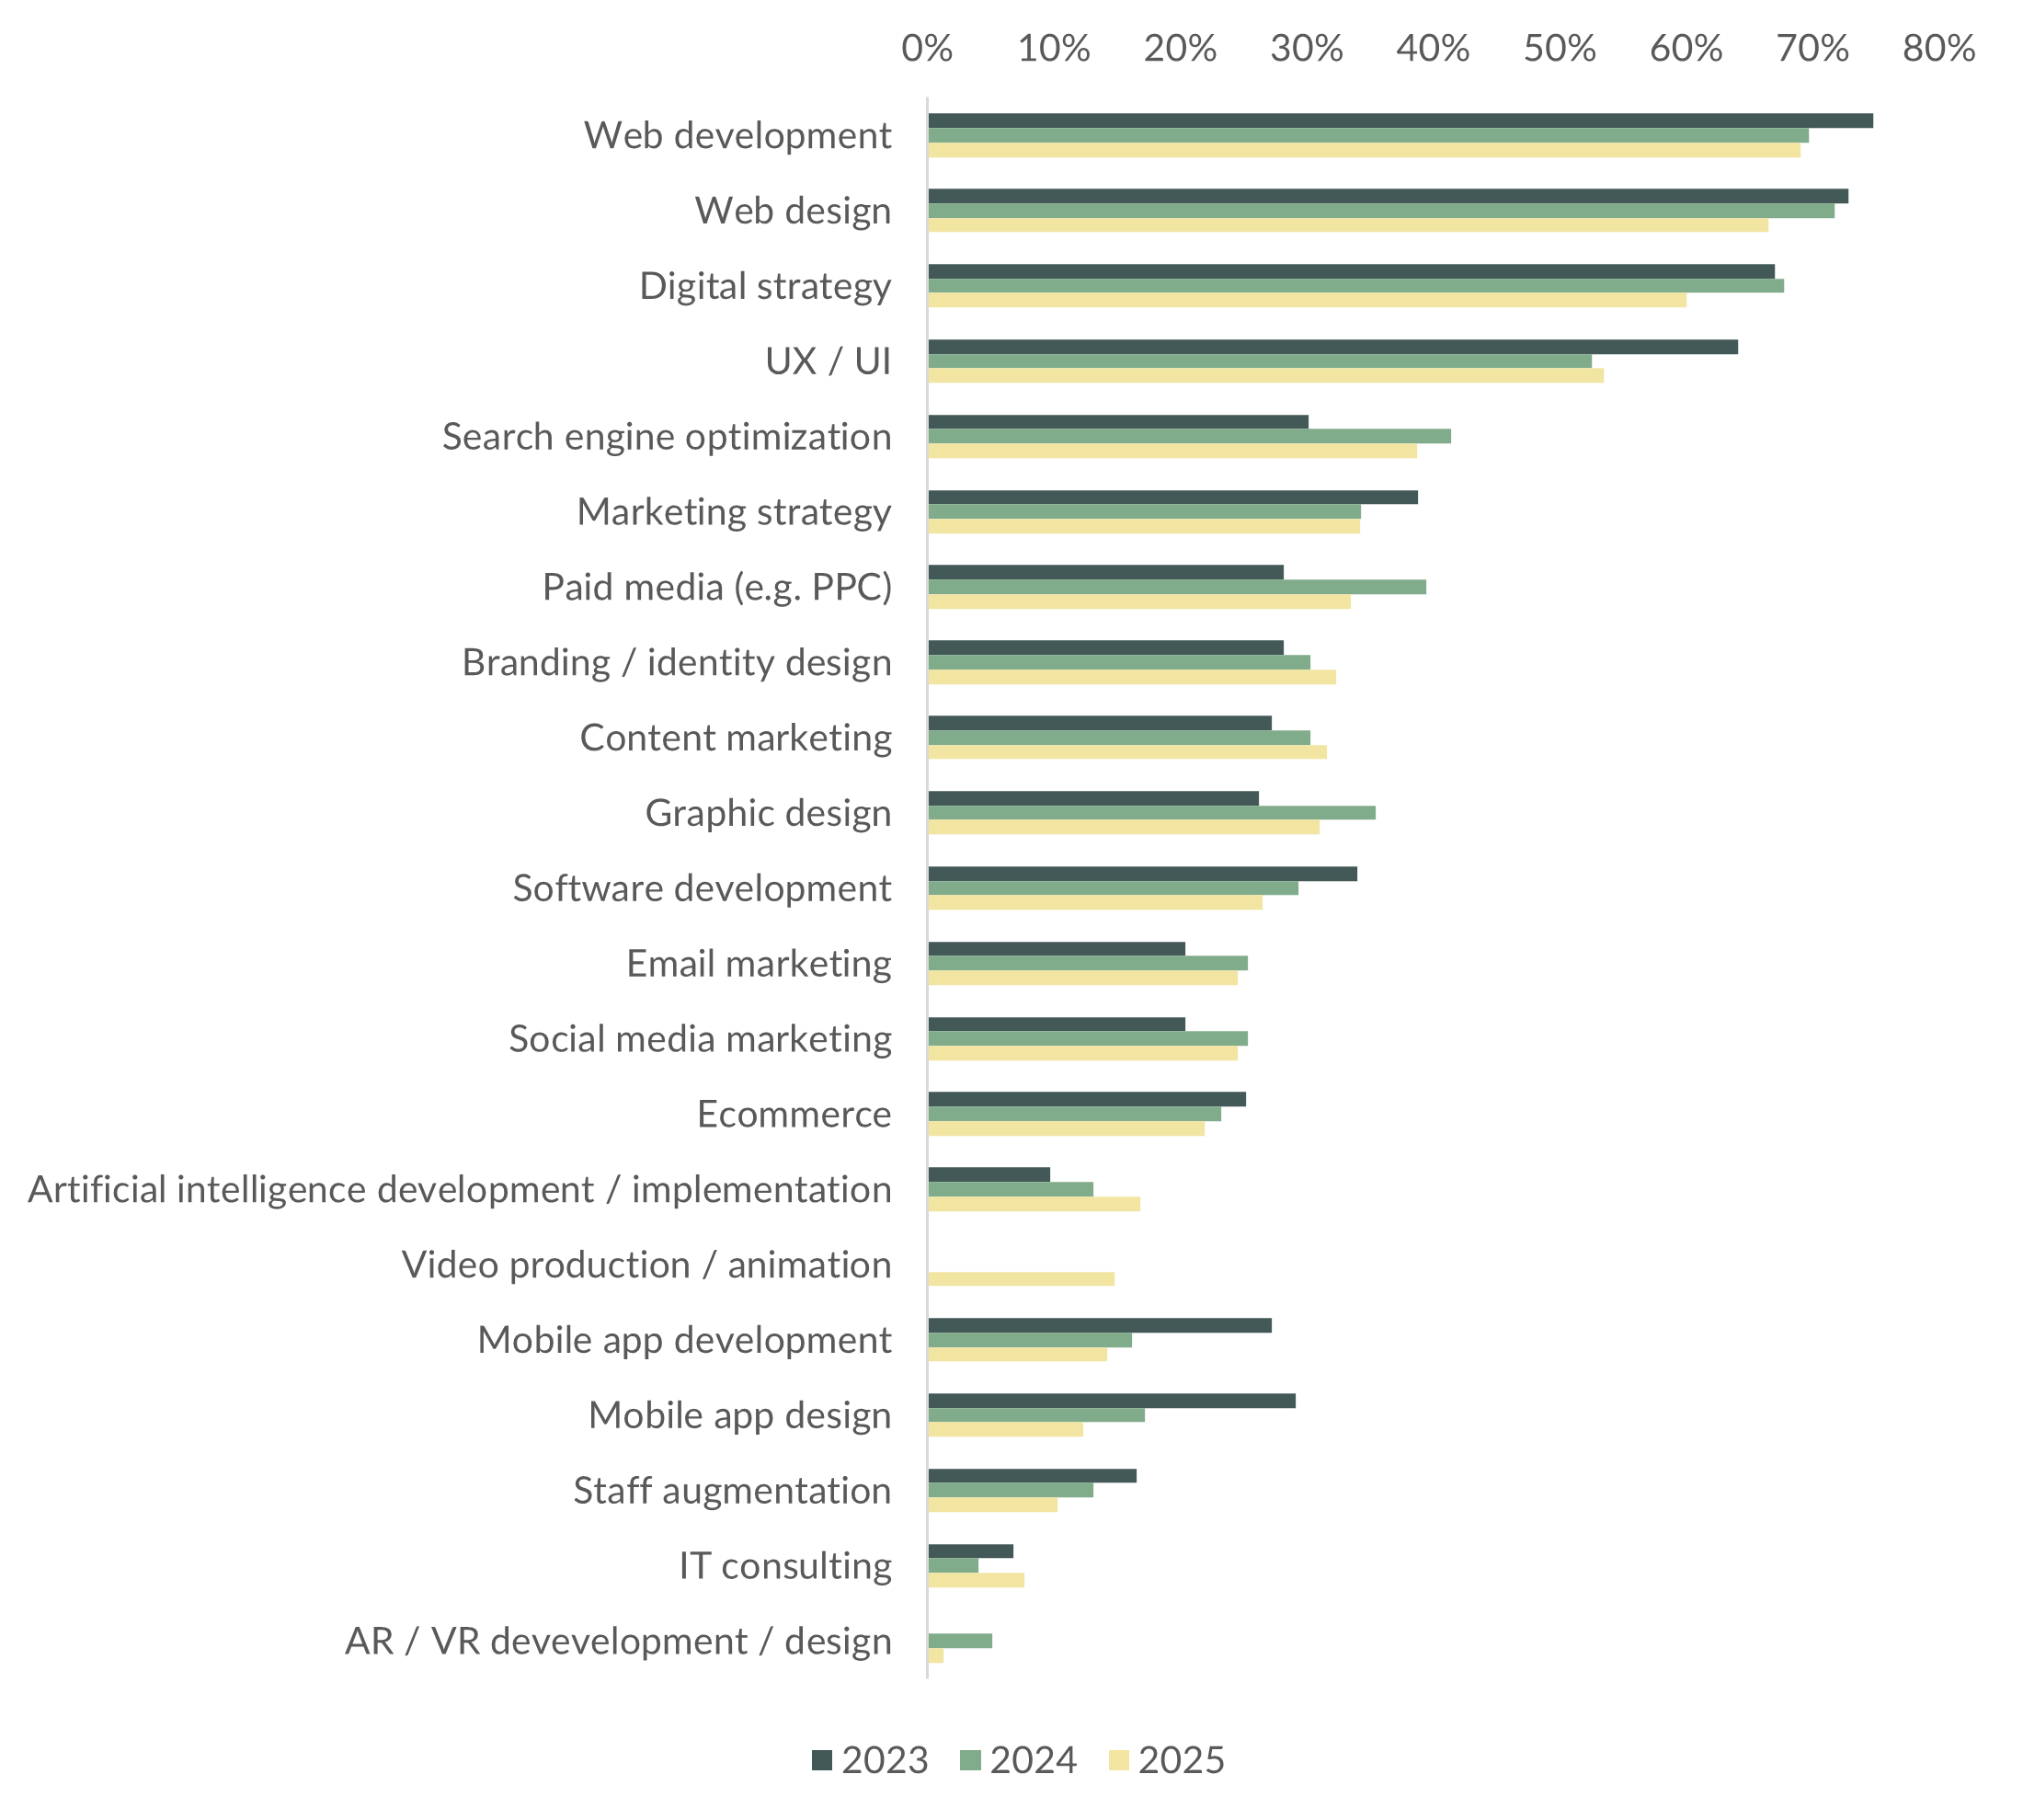
From 2023 to 2025, we saw a modest decline in the traditionally dominant services like web development (from 75% to 69%) and web design (73% to 67%). These remain the most commonly offered capabilities, but this slight erosion, coupled with the fact that agencies are maintaining their average number of services, suggests that agencies are slowly shifting their service mix out of these areas. This could be due to in-housing, commoditization threats, the growth in site builders, or a combination.
Digital strategy stayed relatively steady through 2024 but dipped notably in 2025 (from 68% to 60%), hinting at either a reframing of the service or consolidation under broader consulting engagements.
Top Growing Agency Services
AI-related services grew steadily, from 10% in 2023 to 17% in 2025. While still a minority offering, its upward trajectory signals early-stage adoption, especially among larger or more innovative shops.
There’s a clear upward movement in branding, content marketing, and graphic design, each growing 4-6 points. SEO and paid media also jumped in 2024, suggesting renewed client demand for performance marketing. Though paid media pulled back slightly in 2025, it remains higher than its 2023 baseline.
Notably, email and social media marketing both rose 5 points from 2023 to 2024 and held steady in 2025. This suggests a rebalancing of demand toward owned media and direct response channels, likely driven by rising customer acquisition costs.
Declining Agency Services
UX/UI saw a steep drop from 2023 to 2024 (64% to 53%) and remained flat afterward. Similarly, mobile app design and development declined significantly, from 27–29% in 2023 to just 12–14% in 2025.
We believe the drop in mobile app dev/design demand is largely due to the massive pull-forward in demand in 2021 as many brands rushed mobile builds.
More articles
New Agency Research: Digital Agencies Face Stiff Headwinds in 2025 After a Tough 2024
State of Digital Services 2025 Executive SummaryDigital agency growth stabilized in 2024 but varied by size. Studio shops returned to long-term growth levels, Small shops maintained slow but steady gains, and Medium and Large agencies experienced mild contractions for...
Agency Benchmarks for Assessing Fragility
Benchmarks to Tell When an Agency's Running Hot It isn’t easy to tell when an agency’s running hot. It’s especially difficult when revgen’s covering everything up. We saw this in 2023. The revgen tide receded, and the bony wreckage of nasty agency metrics littered the...
Stabilizing Digital Agencies With & Without Benchmarks
The easiest way to identify issues at an agency is benchmarking. It’s one of the first steps I take when building growth strategies because it tells me where to dig deeper. Here’s what I evaluate, some questions I ask, and some notes on implications: Revgen Revenue...
Our latest insights on running digital agencies
Exclusive research opportunities, thoughts, and advice on the digital agency industry every two weeks.

"Best / most valuable updates from anyone in ages. I get hit up soooooo much, keep this kind of newsletter / value up."
Wil Reynolds
CEO, Seer Interactive


